Introduction
I have tried many times in the past to create a Grafana dashboard with InfluxDB. Every single time, I’ve had it fail and decided to abandon the project. This time, I decided to try again with a blog from TechnicalRamblings.
InfluxDB and Telegraf
Luckily the installation for Telegraf is very simple. I searched for the app in the Community Apps and installed the default configuration.


Next was Telegraf, this requird much more configuration. I searched Telegraf and prepared to download it. I didn’t apply anything as I wasn’t finished yet.

I opened my Unraid terminal and typed the following commmands to download the default config for Telegraf.
/mnt/cache/appdata
mkdir telegraf
cd telegraf
wget https://raw.githubusercontent.com/influxdata/telegraf/master/etc/telegraf.conf
nano telegraf.conf
Inside the file, I did Ctrl+Shift+- to go to the lines I needed. On line 115, I uncommented the line and changed the IP to my Unraid server IP.

I then uncommented line 6154, 6504 and 5635.


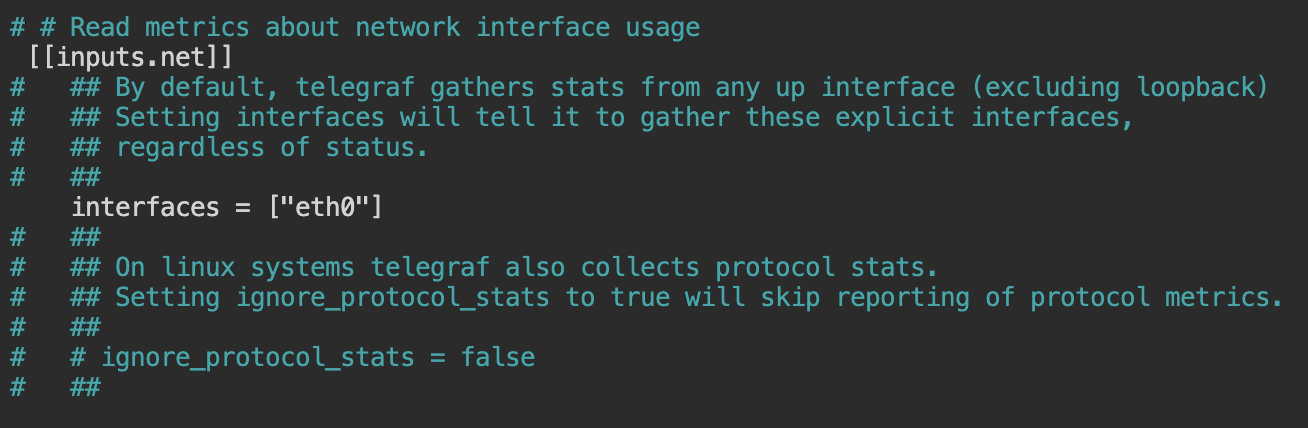
On line 5593, I uncommented interfaces = ["eth0"] as well.
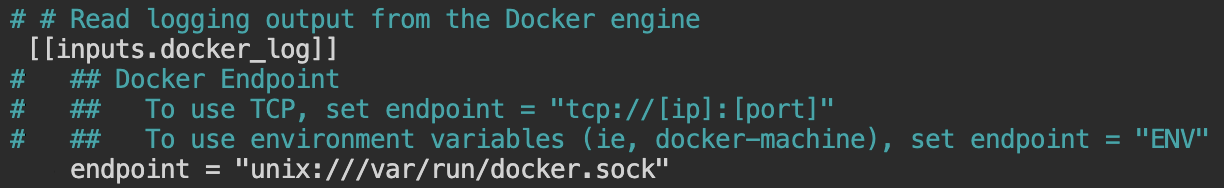
Finally, on line 7626 I uncommented endpoint = "unix:///var/run/docker.sock" as well.
I saved the file and went back to the Telegraf configuration in Unraid. I turned on Advanced View and pasted the following in Post Arguements.
/bin/sh -c 'apt update && apt install -y smartmontools && apt install -y lm-sensors && telegraf' --user 0

I then clicked Apply to deploy the container. I noticed that the container stopped once it started, and when I check the logs I got this error.

After some searching online, it stumbled upon a Reddit thread. I recreated the Telegraph container with the repository set to telegraf:1.20.2.

Grafana
I went to the Community Apps and downloaded Grafana.

I changed Key 1 to my Unraid server’s IP and Key 2 to a new admin password.

I then clicked Apply and went to my Unraid server’s IP and the port that I set (3000). I logged in with the admin as the username and the password that was set. I was now ready to add my first data source.

I clicked Add your first data source and then InfluxDB.

I changed the Name to one that I found suitable. The HTTP URL was set to the Unraid server and port 8086.

I then changed the Database to telegraf and HTTP Method to POST.

This is where I started encountering problems.

Troubleshooting
I did some Googling on the error message, but the results were everywhere and there were a lot of things I could try. I went through a few forum posts but since I was new to Grafana, it seemed daunting to try some of the solutions. I decided before trying any of them, I reread the blog post. I noticed one of the first cautions mentioned was to use to use InfluxDB v1.8. I went into my InfluxDB configuration and changed the Repository: to influxdb:1.8.4.

Thankfully, the configuration worked after that change.

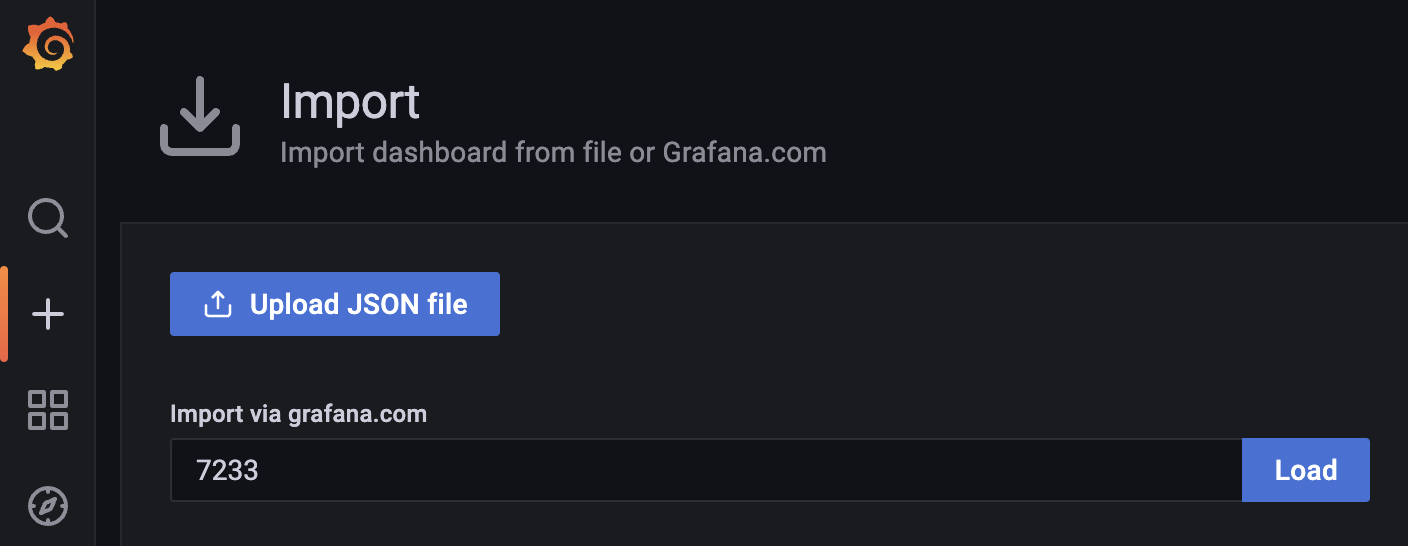
I then imported the following dashboard.

Incorporating NUT
The way I first discovered the previous blog post was this one on adding NUT to Grafana. I serached for nut influxdb exporter on the Community Apps and downloaded it.
I changed INFLUXDB_HOST and NUT_HOST to my Unraid IP. My APC UPS reports nominal power so I removed WATTS/Nominal Power.


I then added the database to Grafana with a similar configuration to the other. The difference was that database was set to nut and HTTP Method was get to GET.


All that was left was to import the dashboard and admire the work.

Conclusion
This was a lot of work, and I remember why I stopped in all of those previous attempts. My dashboard needs some troubleshooting as some data isn’t showing up, but I’ll deal with that another time. Hopefully it won’t be so difficult.